
Trend analysis definition includes collecting historical data for use in identifying trends over time, so finance professionals and businesses may forecast and make sound choices. Encompassing numerous forms and methods, trend analysis offers many benefits, but also one must comprehend the limitations.
What is Trend Analysis?
Trend analysis definition entails the accumulation of historical data points over time and evaluating them for the purposes of identifying persistent patterns or trends. Concisely, trend analysis entails the study of historical performance for the purposes of ascertaining what may happen in the future in markets, finance, or business.
Companies can view trends increasing, decreasing, or levelling off by utilising trend analysis, which allows them to predict the future, strategise, and make choices. Because what trend analysis performs is not merely identifying raw data movement but also identifying the cause of the movement, corporations get actionable insight, not merely figures.
Why is Trend Analysis Important in Business & Finance?
- Helps organisations predict future outcomes based on past and current data.
- Supports strategic planning, resource allocation, budgeting & investment decisions.
- Key in financial planning, market understanding, and staying ahead of competition.
Trend analysis is significant, as, for both finance and business, the ability for trend forecasting offers a company a competitive edge. Improved budgeting, quick reactions when the market shifts, avoidance of risk, and successful strategy decisions stem from this.
What are the Types of Trend Analysis?
There are a number of types of trend analysis used for various purposes by considering intent, data access, and need for precision.
Horizontal Analysis
Horizontal analysis (or trend‑% analysis) compares financial or operating figures between a grouping of time intervals for the purposes of seeing growth, decline or stability. As a quick example, comparing year‑over‑year revenue for revenue growth. Horizontal analysis provides long‑period trends for indicators like these: sales, costs, and profits.
Vertical Analysis
Vertical analysis places each component of financial statements (e.g., a financial statement of income) as a percentage of a base value (e.g., total revenues) for the same time interval. As a result, structure may now be compared between time intervals even if size differs. e.g., cost of goods sold as a % of revenues, or operating costs as a percent of revenues.
Time Series Analysis
Time series analysis is a statistical procedure from trend analysis which sequentially over time examines sets of data points (stock prices each day, month-end sales, for example). The time series may suggest seasonal effects, cycles, or long‑range trends. Smoothing techniques, moving averages, regression, and so on may be utilised.
Comparative Analysis
Comparative analysis (of trend analysis) involves the comparison of data between various entities: competitors, industry standards, or various segments of a company. For example, the comparison of the time-series financial ratios of one company vs another from the same industry to observe relative performance. This kind provides a context for a trend as opposed to observing the latter in isolation.
Technical Trend Analysis (in Stock Market)
Technical trend analysis examples use chart analysis, technical indicators, trendlines, volume, and momentum for the detection of stock prices/market indices patterns. Technical trend analysis simplifies the traders’ decision‑making for uptrends, downtrends, reversals, and support/resistance points. Technical trend analysis is short‑term orientated and widely used by investors/traders.
Curious About What is Trend Analysis?
What are the Benefits of Trend Analysis?
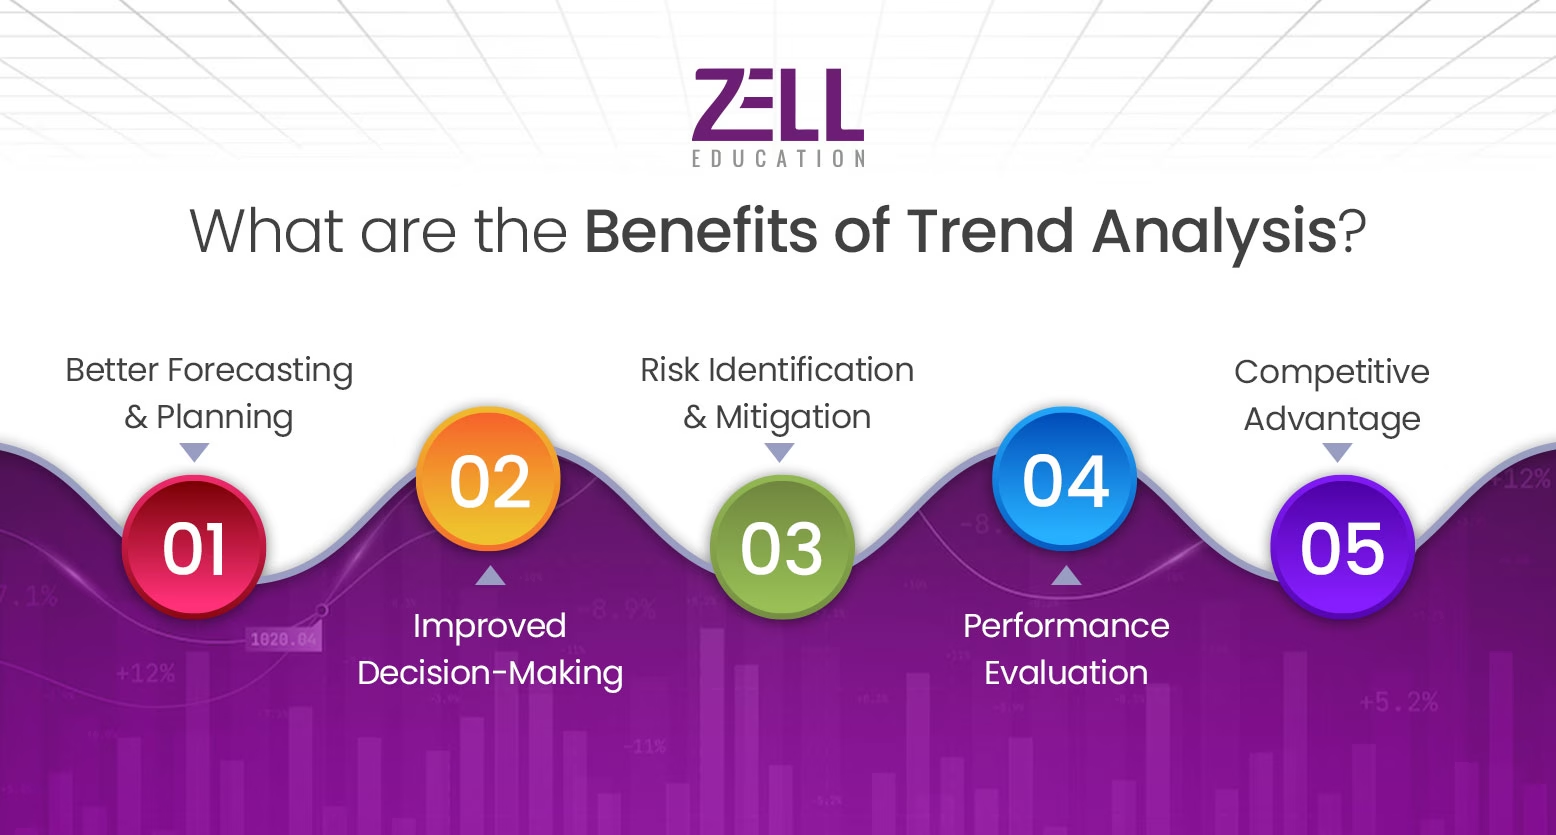
Better Forecasting & Planning
- Enables forecasting future sales, revenues, and costs based on past patterns.
- Helps in planning inventory, staffing, production, and marketing budgets more precisely.
Correctly analysing trends (for instance, a retailing firm monitoring holiday sale increases every year), the manager can predict inventory well in advance of a potential stockout or overstock.
Improved Decision‑Making
- Data‑driven decisions instead of guesses.
- Assists with deciding whether to diversify a product line, venture into new markets, or drop unsuccessful ones.
Risk Identification & Mitigation
- Spot negative trends early (decline in sales, rising costs) and take corrective action.
- In finance, for example, identifying downward trends of liquidity or increasing ratios of debt prevents crises.
Performance Evaluation
- Measure how different departments, products, or strategies are performing over time.
- Evaluate the effectiveness of past decisions, campaigns, or policies using trend results.
Competitive Advantage
- Firms which successfully manage trends can anticipate changes in customer behaviour, changes in the market, and regulatory impact.
- Anticipating trends provides for first‑mover advantage or quicker adaptation than the competition.
What are the Limitations of Trend Analysis?
- Historical trends cannot consistently predict the future surprises for markets because the trends could get invalidated by external shocks or by a change in regulation.
- Data quality problems: absent, imprecise or inconsistent historical records may confuse analysis.
- Over-reliance on numeric data might ignore qualitative factors like customer sentiment, innovation, and competitor moves.
- Trend analysis limitation illustrative example: a company that had been consistently increasing may drop sharply since a new competitor emerges or a technology disruption arrives which the historical data could not predict.
What are Real‑World Applications of Trend Analysis?
In Financial Reporting
Trend analysis for financial reporting reveals the change over time for items (revenue, costs, profits). Stakeholders use it for growth, stability, and financial health evaluation. Financial analysts also tend to compare the balance sheets from one year to another by the use of horizontal & vertical trend approaches.
In Investment & Stock Market
Technical trend analysis enters the frame. Trend analysis examples of chart patterns, moving averages, and support/resistance are utilised by the traders for the prediction of the stock movement. The long‑term investors also make use of trends of macroeconomic data or market sectors for the determination of capital allocation.
In Business Strategy & Market Research
Companies use trend analysis for determining customer demand shifts and product development opportunities. The market study uses predicted trend tendencies for deciding product launches and advertising pushes. Companies also compare competitors’ trends and market norms.
How to Perform Trend Analysis Step‑by‑Step?
Collect Historical Data
Collect accurate, consistent data for intervals (months, quarters, years) corresponding to what you wish to study (sales, prices, customer behaviour, etc.). Make sure the data is of high quality, complete, and consistent.
Select the Right Method (horizontal, vertical, technical, etc.)
Choose from horizontal analysis, vertical analysis, time series, comparative, or technical trend analysis depending on what is suitable for your goal. Technical trend analysis may suit stocks, time series for revenue forecasting, and vertical for the analysis of cost structure.
Analyse Patterns & Variations
Plot the data onto a chart, calculate growth rates and change ratios, and use smoothing or a moving average. Spot seasonal trends, shifts, anomalies, and up/dropping/horizontal trends. Watch out for outliers.
Interpret Results & Make Projections
Using trends you’ve observed, translate their meaning: growth, risk, change needed. Then predict or forecast for later time horizons. Use trend analysis examples to estimate revenue a year from now or calculate product mix changes. Lastly, integrate into planning, set up KPIs and measure against actuals.
Want to Pursue Finance and Accounting Career?
To Book Your Free Counselling Session
Conclusion
If you know what is CMA, then you must know that trend analysis in CMA certification is a robust analytical methodology that makes businesses as well as finance professionals conscious of what occurred historically and puts this insight into use for forecasting, planning, and making prudent decisions.
Although trend analysis cannot operate without high-quality data and cannot predict sudden change, the benefits of the kind of effective forecasting & planning, effective decision-making, risk anticipation, and performance evaluation, as well as a competitive advantage, make it indispensable. Businesses planning growth put a combination of the various types of trend analysis and relevant result interpretation as the eventual path for extracting long-term strategic advantage, especially in areas like the CMA course.
FAQs on What is Trend Analysis
What is the primary purpose of trend analysis?
The primary aim of trend analysis consists of the examination of historical data so as to identify entrenched patterns which help predict future outcomes, support decision‑making, and assist forecasting & planning.
What are the three major types of trend analysis?
The three main types of trend analysis are horizontal analysis, vertical analysis, and time series analysis.
How is trend analysis used in financial statements?
Applied via horizontal analysis (line item comparison over multiple time intervals) and vertical analysis (expressing items as a percentage of a base like total revenue), it helps us determine growth and profitability, as well as cost structure.
What are the benefits of trend analysis in stock market trading?
In the stock market, trend analysis helps traders identify upward or downward trends, support/resistance levels, momentum, entry/exit points, and risk areas, improving chances of profitable trades.
What are the limitations of trend analysis in decision‑making?
Limitations are due to dependence on historical data which may prove obsolete due to external shocks, data of unreliable quality, neglect of qualitative aspects, and the danger of oversimplification or misleading forecasts.
How does trend analysis help in business forecasting?
Trend analysis provides historical trends in the data which form the basis of forecasts, enabling firms to forecast future figures (sales, costs, etc.), set goals, budget, and plan.

Current Role
Co-founder and Executive Director at Zell Education
Education
- Chartered Accountant (CA) from The Institute of Chartered Accountants of India (2010 – 2015)
- Company Secretary (CS) from The Institute of Company Secretaries of India (2011 – 2013)
- Bachelor in Financial Markets, Finance, General from H.R. College Of Commerce & Economics (2010 – 2013)
Location
Mumbai, India
Expertise
CA Certified, CS Certified
Why Zell?
- • Largest Provider for Global F&A Courses
- • 4.6 Google Review Rating
- • 1000+ Students placed Annually
- • 500+ Active Hiring Partners
- • Placement Opportunities at the Big 4
- • 100+ Global & Indian Rank Holders
- • 100+ Faculty Network
Speak to A Career Counselor
Zell's 10th Anniversary Offer - Avail a 10% Scholarship